Blog Gigs Facts Music Shop Links
Blog: Shifting Units
| < previous | next > |
This is partly to bypass any problems to do with INFLATION (which you may have seen mentioned on The News lately) skewing the figures, but mostly it's because it would seem a bit WEIRD to be discussing such things in a public forum. This is more to do with INNATE BRITISHNESS than anything to do with TAX AVOIDANCE or similar - 25% of Pretty Much Sod All works out as roughly Almost Nothing - although I did spent years and years PANICKING about what would happen if THE TAXMAN started to take an interest in my GIG SALES and I got a) told off b) FINED. IN the end I WROTE to them to explain what I'd made from gig sales and so forth to see if they wanted me to send them any money and they wrote back to say that, with the amount I was bringing in (and SPENDING) it was all FINE. I like to imagine someone in the tax office LARFING OPENLY at my puny worries, I do hope it brought them some light relief in their labours!
As part of this ONGOING FEAR I've kept records of my ROCK incomings (and much greater ROCK outgoings) since 2003, and the DREAD has meant that I've kept it pretty accurately. However, I don't think anyone is particularly interested in how many times I stayed at The Ibis in my rocking career (despite the fact that I seem to be CONVINCED people are FASCINATED by how many times I played each song) so this is going to just look at GIG SALES i.e. how many UNITS (CDs, badges, tapes, t-shirts etc) I sold at each gig.
The finance data was recorded by DATE rather than gig, so there was a little bit of cleaning needed to make it all match up. The main issue was where I did two gigs on the same day, but that turned out to be pretty easy to solve by linking sales to the LAST gig of the day, which was always the one where the sales occurred. With that done I was able to generate a whole heap of GRAPHS, the first of which shows how many units were sold per year.
Items Sold By Year
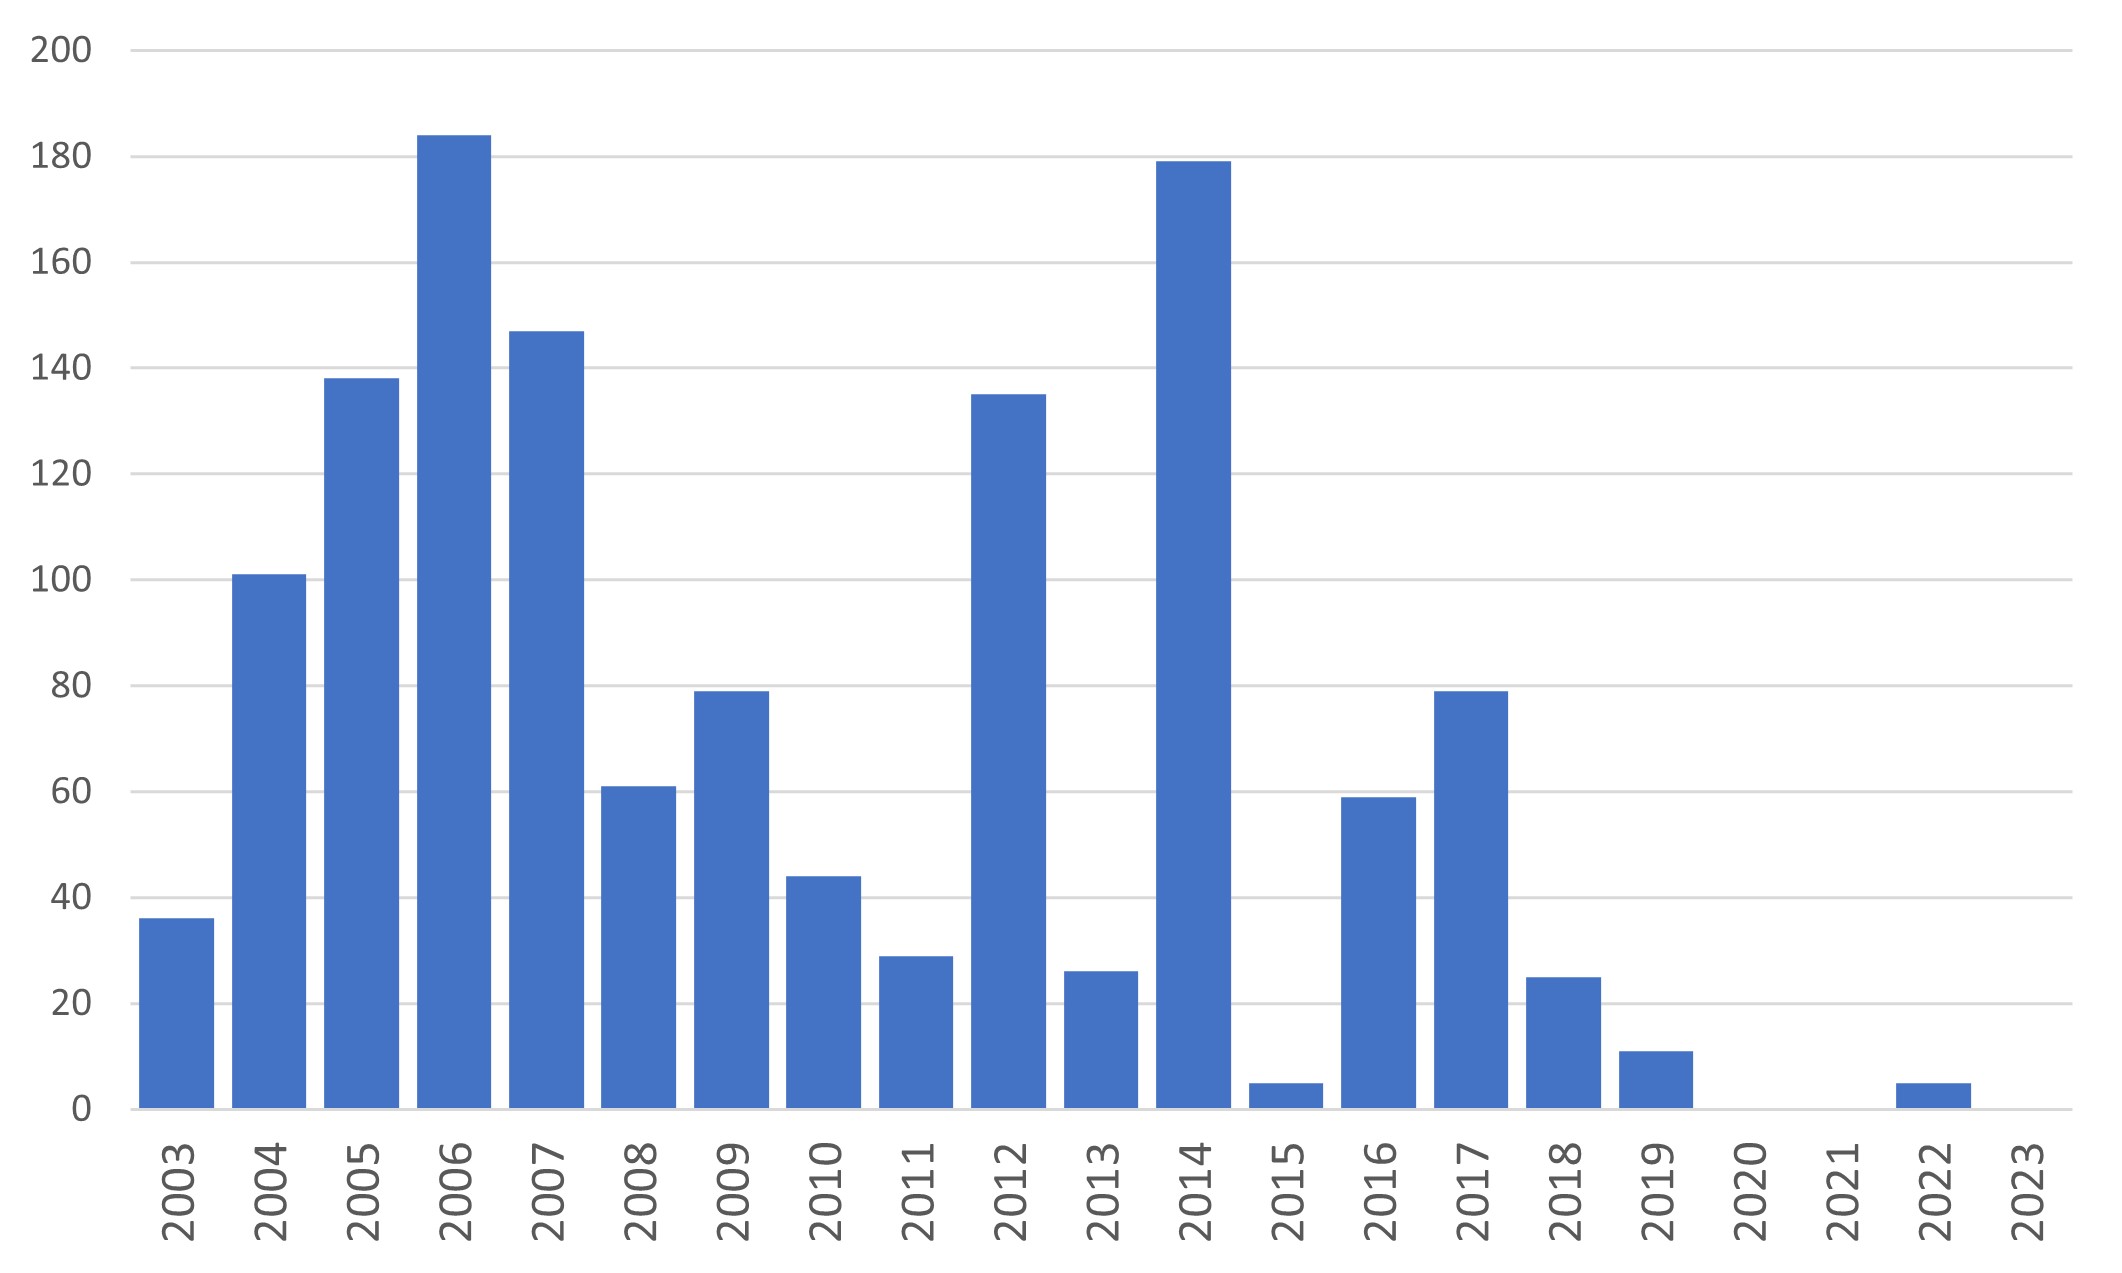
Isn't that a lovely bit of GRAPH? The ups and downs generally relate to dates of album releases, with a clear rise in sales up to 2006, which is when WE VALIDATE! came out, a gentle bump back up for Regardez, Ecoutez Et Repetez in 2009, and then something similar around 2016/17 for Still Valid. However, there's a mighty great leap in 2014 when I didn't release ANY physical product at all. Could this somehow be linked to the NUMBER of gigs I/we did during this time? To find out I've done ANOTHER lovely graph, this time looking at the AVERAGE number of units sold per gig:
Average Items Per Gig, By Year
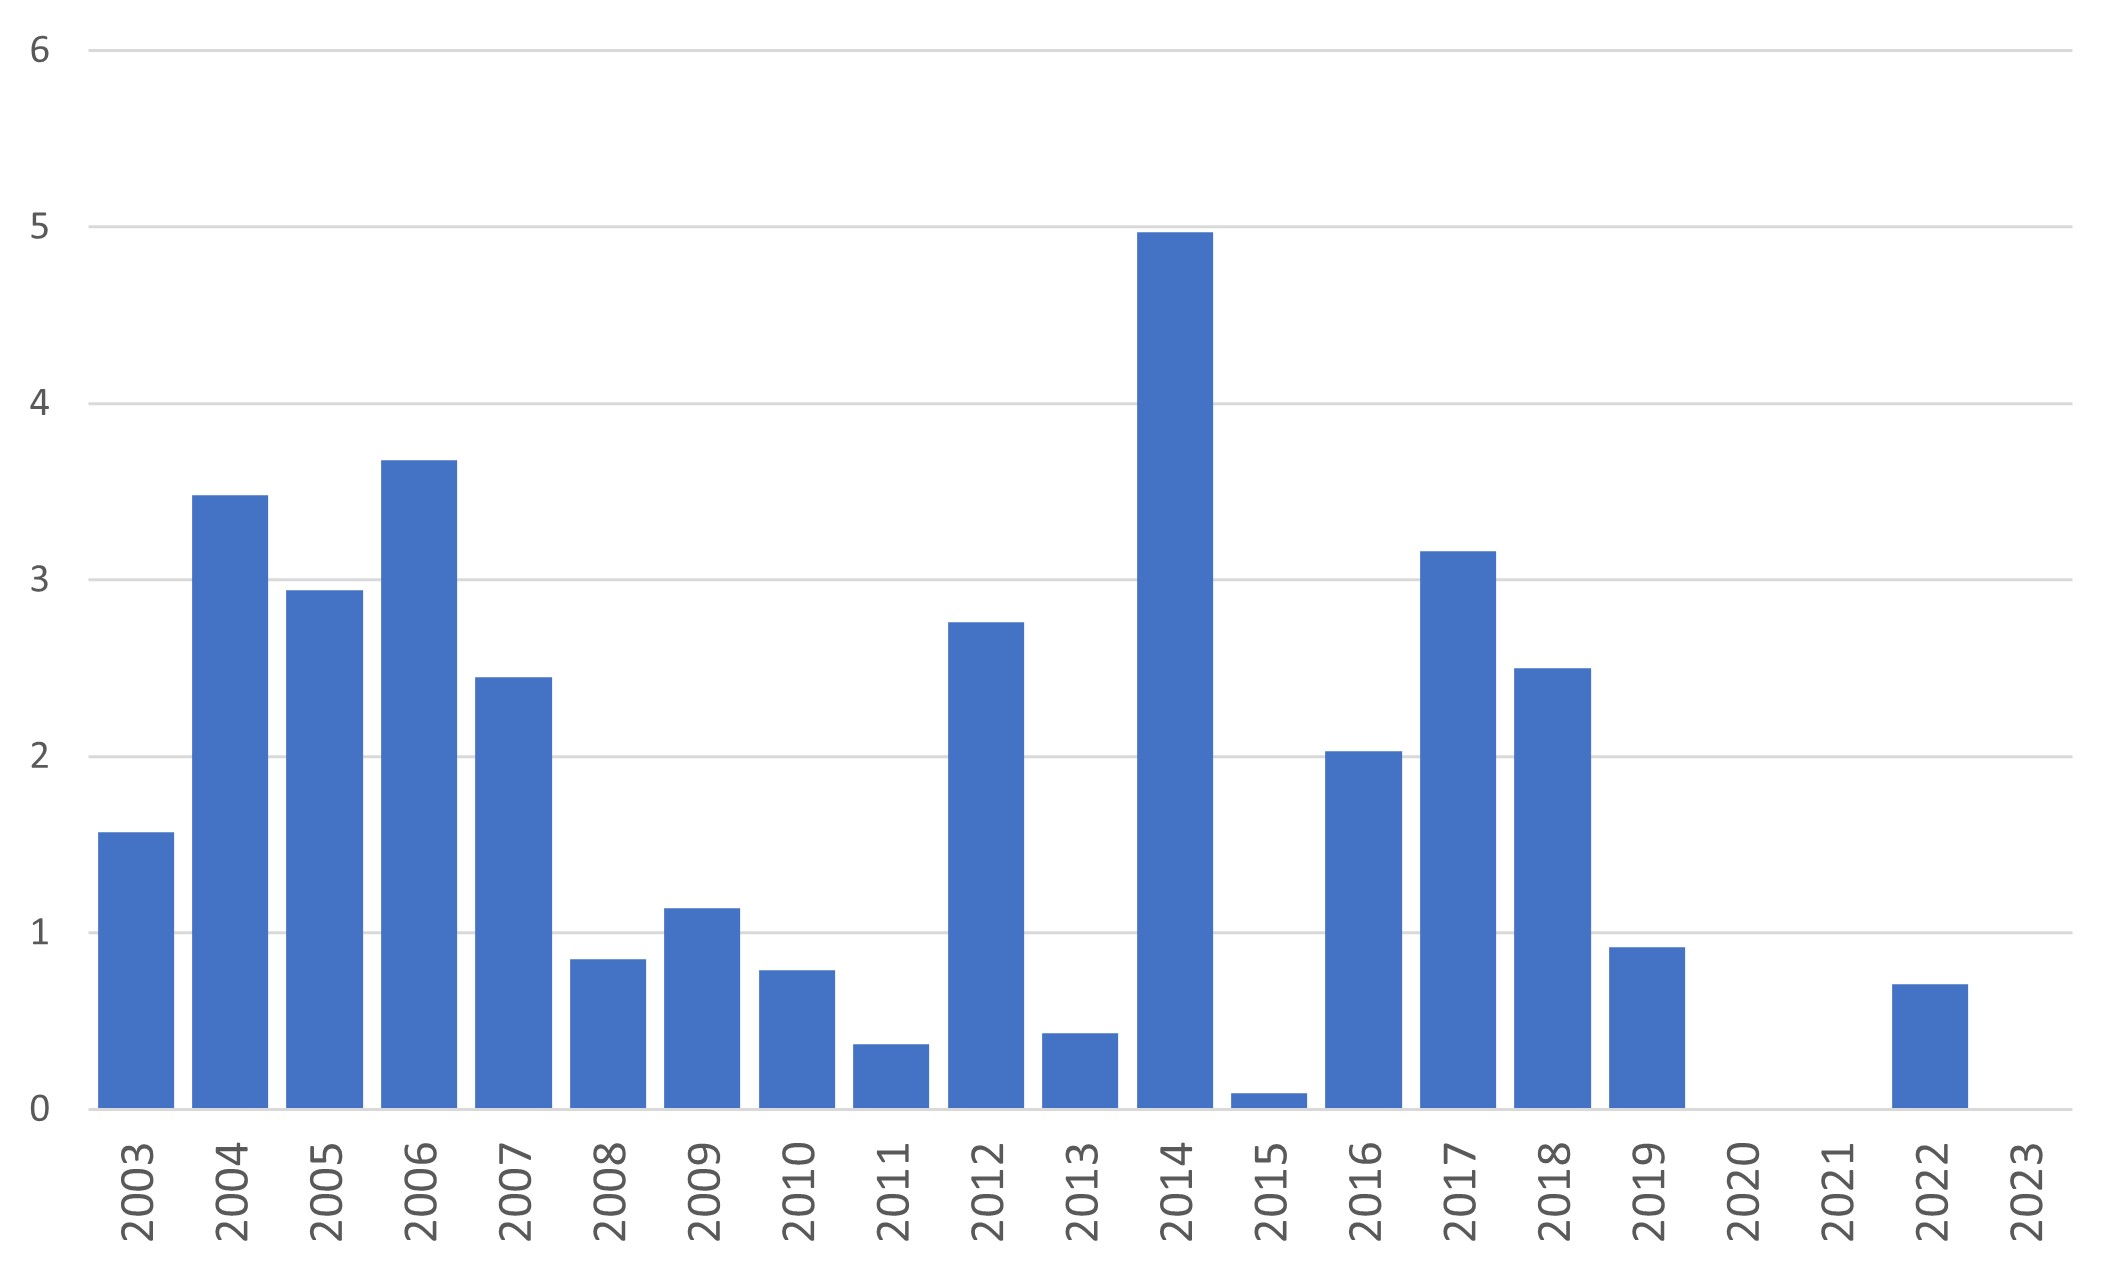
If anything this makes the peak in 2014 even MORE pronounced, while also making the 2016/17 Still Valid-era sales figures match up, per gig, much more to the ealier years. This surprises me, to be honest, as I thought there'd been a gentle tailing off of Live Sales over the years, but it seems not to be the case, at least not at that point. There clearly IS a massive drop off in sales in recent years, but that's mostly because the gigs I've done have been VIRTUAL ones, and you can't wander round hassling drunken people into buying stuff so easily at those!
Still, I did expect the number to go down as time went buy purely because of the changes in the ways that it's been POSSIBLE to buy stuff. At the start of the century it wasn't easy to track down music by Properly Independent Types like what I am - you could go to independent record shops, but even THOSE didn't sell music by PROPER indie people (mostly because they didn't answer the EMAILS that proper indie people sent them - not that I am still annoyed about it OBVS). Getting a distribution deal was a RIGHT hassle and also a bit of a rip-off for those of us with more BOUTIQUE sales figues, and even if you COULD get distributors to carry your music it didn't mean shops would actually STOCK it, so for people like me it was either selling stuff online with PayPal (which lots of people didn't like) OR trying to flog it at gigs.
This wasn't really a problem though, as I used to love selling stuff at gigs! I have very fond memories from my heyday of a) gigging b) selling, when I'd wake up the morning after a gig and go through my trouser pockets digging out SWEATY BANK NOTES, all folded up and drunkenly shoved in the night before. I used to put money from SALES in one pocket and any money for PERFORMING in the other, and then have to work out which was which and how much of it I'd then spent on BEER!
However, none of this CHARMING NOSTALGIA is getting us any closer to seeing what's really going on in these graphs, so tomorrow we'll have a look at WHERE the sales happened, and who WITH!
posted 16/2/2023 by MJ Hibbett
| < previous | next > |
 An Artists Against Success Presentation